Crystal compiler does a lot of work in order to allow the programmer be more expressive, productive, and …lazy.
Since 0.7.7 the compiler comes with some initials tools that will help the programmer know what the compiler is understanding from the code and to navigate through in a more interesting way.
When compiling a method call, the compiler knows exactly which method definition will be called. But, when the programmer is viewing the source code, there was no way (other than string search) to reach the method definition.
Bigger the project, harder to find the definition.
So if you have program.cr with the following code:
1
2
3
4
5
def add(a, b)
  a + b
end

add(1, 2)
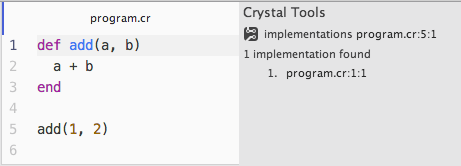
$ crystal tool implementations --cursor program.cr:5:1 program.cr
1 implementation found
/path/to/program.cr:1:1
You can pass --format json to make a computer friendly output and build something to integrate it to you favorite text editor. This is used in then crystal-tools atom package and it just looks awesome. Every location is just clickable.

If you use Atom download them and just press ⌘⌥i / ctrl-alt-i while your cursor is over the add in line 5.
This tools does not only will be allow you avoid def foo vs def self.foo string matching hell, but will point which are the real candidates of a method call.
1
2
3
4
5
6
7
8
9
10
11
12
13
14
15
16
class A
  def foo
  end
end

class B
  def foo
  end
end

def use_foo(o)
  o.foo           # put the cursor in this #foo call
end

use_foo(A.new)
use_foo(B.new)    # if removed, line 7 won't be an implementation of line 12
A snippet is worth a thousand words.
1
2
3
4
5
6
class Person
  property name
end

p = Person.new
p.name = "John"   # put the cursor in over #name= call
$ crystal tool implementations --cursor program.cr:6:6 program.cr
1 implementation found
/path/to/program.cr:2:3
 ~> macro property: /path/to/crystal-src/object.cr:365:5
 ~> macro setter: /path/to/crystal-src/object.cr:324:9
And you know how object.cr looks like?
class Object
  # ...
  macro setter(*names)
    {% for name in names %}
      {% if name.is_a?(DeclareVar) %}
        def {{name.var.id}}=(@{{name.var.id}} : {{name.type}}) # line 324
        end
      {% else %}
        def {{name.id}}=(@{{name.id}})
        end
      {% end %}
    {% end %}
  end
  # ...
  macro property(*names)
    getter {{*names}}
    setter {{*names}}   # line 365
  end
  # ...
end
I love this!
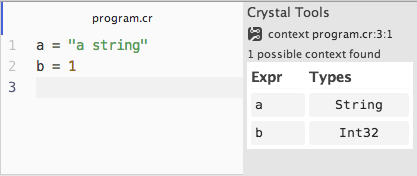
Another neat tool that will help you avoid all thouse run with pp var or pp typeof(var) is the context tool. Just position your cursor somewhere ⌘⌥c / ctrl-alt-c and you will all variables type information.

Like in the previous tool, the program itself is never executed. All the information shown cames from the same build process that generates the binary.
The tool is available in command line manner.
1
2
a = "a string"
b = 1
$ crystal tool context --cursor program.cr:3:1 program.cr
1 possible context found

| Expr | Type   |
-----------------
| a    | String |
| b    | Int32  |
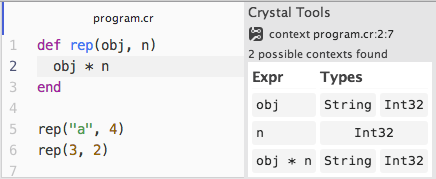
It’s interesting thou to see all the overload a def holds.

It’s work in progress :-). We want more tools, and to make them robust enough for everyone. We think they are ready enough for you to enjoy them, and help us making them better.
The crystal-tools atom package will probably get crystal spec support so it will be easier to run single file/single spec from the editor.
Another desired tool is to get all caller for a given method. Kind of dual tool of implementations that will answere the question, who is using this code?
Since this tools were built on top of crystal compiler, with all it’s type inference and compiler phases, if the code does not compile you won’t be able to run any tool.
All samples presented here were programs in a single file but the tools do work in larger project. For this to happen the tools need to know the main file to compile. This was the last argument of the commands. The --cursor argument specifies where the text cursor is located in the editor.
For single file programs the main program is just it. For larger programs is not that easy. You as a developer will know which file to compile.
The crystal-tools atom package will use all the specs as main program. If this is not what you need to can change from the settings page which file to compile among other things.
… towards an event better crystal programming experience. ❤
comments powered by Disqus